
Delicious gelato, ancient ruins, and slow buses—the three constants when visiting Rome. While most European cities are paragons of transit excellence, Rome’s bus system is plagued by delay. The average wait time for a bus in Rome is 16 minutes, which does not seem awful—until one considers that this measurement includes the less congested outer suburbs (Moovit, 2022). The same study found that 24% of people riding the bus experience a wait of greater than 20 minutes, and that these long trips come from the downtown core (Moovit, 2022). As a visitor to the Eternal City, my method of transportation has been transit. I have noticed that the buses arrive at stops irregularly, and move slowly through the city. I wanted to understand why. This exploration of Azienda per la Mobilità di Roma Capitale’s bus network will uncover the reasons why buses are delayed in Rome’s city center and what Roman engineers are doing to fix these problems. To connect this project to our hometown, a slow Roman bus route will be analysed next to King County Metro’s Route 8, so as to see what techniques each municipality can learn from the other. Finally, I will provide my own engineering opinion on ways to improve the speed of buses in Rome.
Delicious gelato, ancient ruins, and slow buses—the three constants when visiting Rome. While most European cities are paragons of transit excellence, Rome’s bus system is plagued by delay. The average wait time for a bus in Rome is 16 minutes, which does not seem awful—until one considers that this measurement includes the less congested outer suburbs (Moovit, 2022). The same study found that 24% of people riding the bus experience a wait of greater than 20 minutes, and that these long trips come from the downtown core (Moovit, 2022). As a visitor to the Eternal City, my method of transportation has been transit. I have noticed that the buses arrive at stops irregularly, and move slowly through the city. I wanted to understand why. This exploration of Azienda per la Mobilità di Roma Capitale’s bus network will uncover the reasons why buses are delayed in Rome’s city center and what Roman engineers are doing to fix these problems. To connect this project to our hometown, a slow Roman bus route will be analysed next to King County Metro’s Route 8, so as to see what techniques each municipality can learn from the other. Finally, I will provide my own engineering opinion on ways to improve the speed of buses in Rome.
ATAC Bus Network in Rome’s City Center
Azienda per la mobilità di Roma Capitale (referred to hereafter as ATAC) has a comprehensive bus network in Rome’s downtown and historic center. Due to the presence of Roman ruins underneath every street, building a subway has proven difficult (Engineering Rome Tour of Metro Linea C, 9/21/2026). Unlike many European cities, there is currently no significant metro in the downtown. While there are three lines, each line effectively runs from either a neighborhood or suburb to Termini station. Where many cities would install a metro, Rome must use buses.
The bus network in Rome operates differently from systems that Americans may be familiar with. For one, the buses do not have a true timetable. Instead, each route is given a target frequency (ATAC, 2018). For example, the expectation for route 64 is that there will be a bus arriving at each stop every eight minutes. To provide the people riding the bus with more information, ATAC also provides real time arrival tracking, both on their own website, but also to applications such as Google Maps or Moovit. Also, each route is sorted into a category, and given a numerical designation. For example, as you can see in Figure 1, the full name of the 85 is the Urbana 85, or U 85. Because the U 85 has the Urbana designation, we know that the route has short stop spacing, high frequency, and travels in the city center.
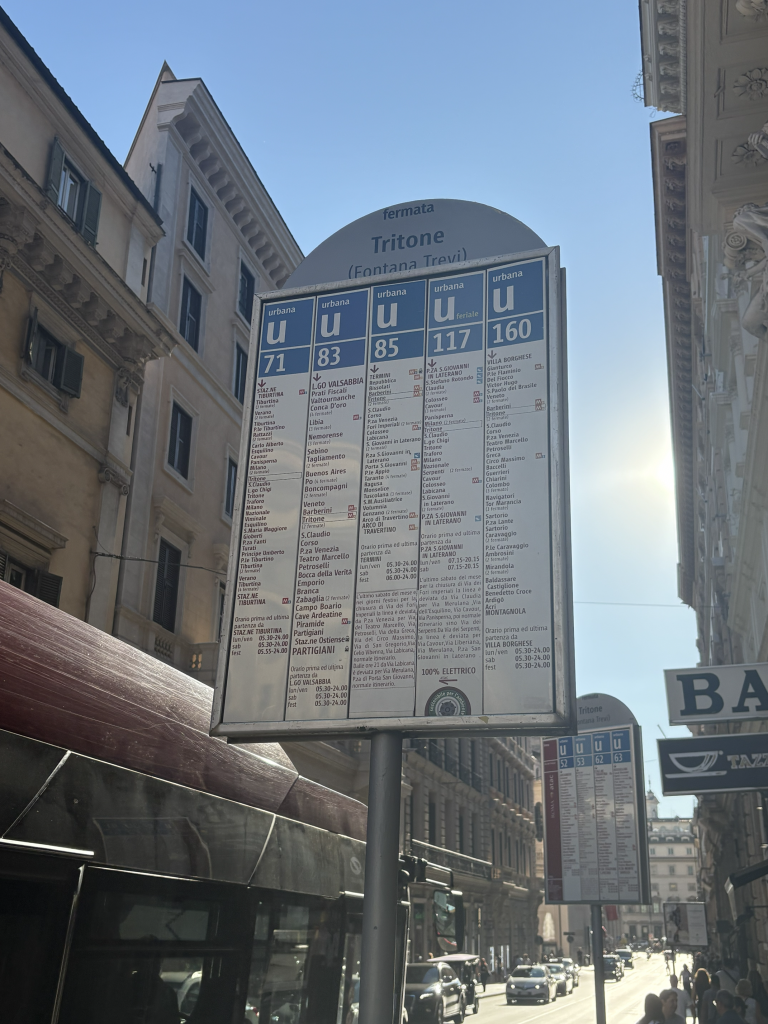
The other designations are as follows: X for Express, long routes with wider stop spacing; E for Esatta, suburban connector routes with exact time tables; N for Notturna, routes that run at night–usually to replace subway service. For this project I am focusing on highly utilized U routes, as well as bus stops that serve as transfer points between many different U routes.
A theme in Rome’s network is a high concentration of routes along specific corridors. Much of the city center has remained unchanged since the middle ages. What this means is that there is no grid—no intentional design behind the street layout. Streets curve and dead end seemingly at random with no consistency. The bus network is forced to stay on the wide and direct thoroughfares. Bus routes are condensed to a select few roads.
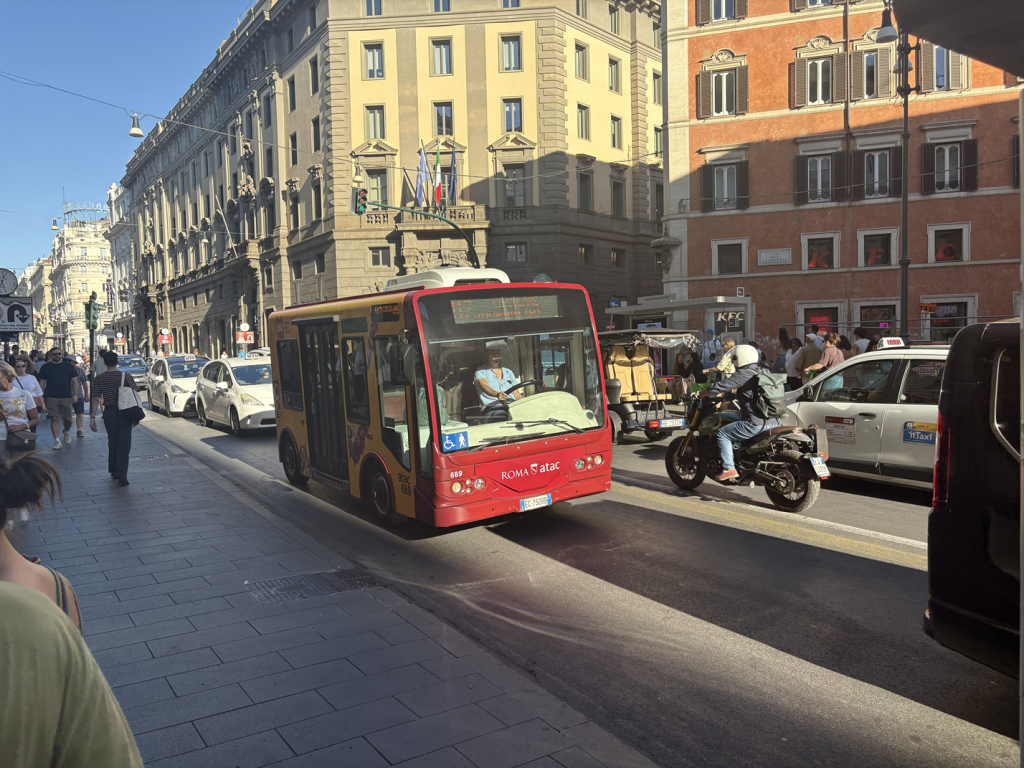
There are several coach types that ATAC deploys on these corridors. Roughly a quarter of the rolling stock are 60’ coaches, mostly used for E and X routes, but the vast majority of buses are 40’ in length. In addition to these two standard offerings, there are also 60’ trolleybuses, and 20’ minibuses. The trolley buses are rare, and are mostly used to supplement streetcar service. The minibuses (shown in Figure 2) are used on three routes, the U 100, U 117, and the U 119 (Turismo Roma, 2020). These small buses are intended to operate on streets larger buses can not, providing greater connection through the network, but in actuality they are routed on the major roads with the rest of the routes.
In short, ATAC operates a plethora of bus routes throughout Rome’s city center. Each route has a category it is sorted into, a different expected frequency, and usually operates with a 40’ coach. Generally, the buses stay on the few wide main roads. With this understanding of ATAC’s bus operations, delays in their system can be investigated.
Determining Bus Delay
Anecdotally, I knew that the buses moved slowly, but I needed to find empirical evidence. ATAC does not publish their speed data, meaning that I had to collect my own data. To do this, I selected four bus stops and two bus routes to observe and document (Figure 3). I combined my observations with published research papers on the subject to better understand the delay in the system. I selected the routes U 64 and U 85 because of their high ridership and because they were convenient to access. One end of each of these routes was at Roma Termini, which is a location that is easy to get to. I selected the Monte Brianzo, Tritone (Fontana Trevi), Ara Coeli (Piazza Venezia), and Corso Vittorio Emanuele (Argentina). These stops were chosen because of the high number of routes that service them, as well as their proximity to the UW Rome Center.
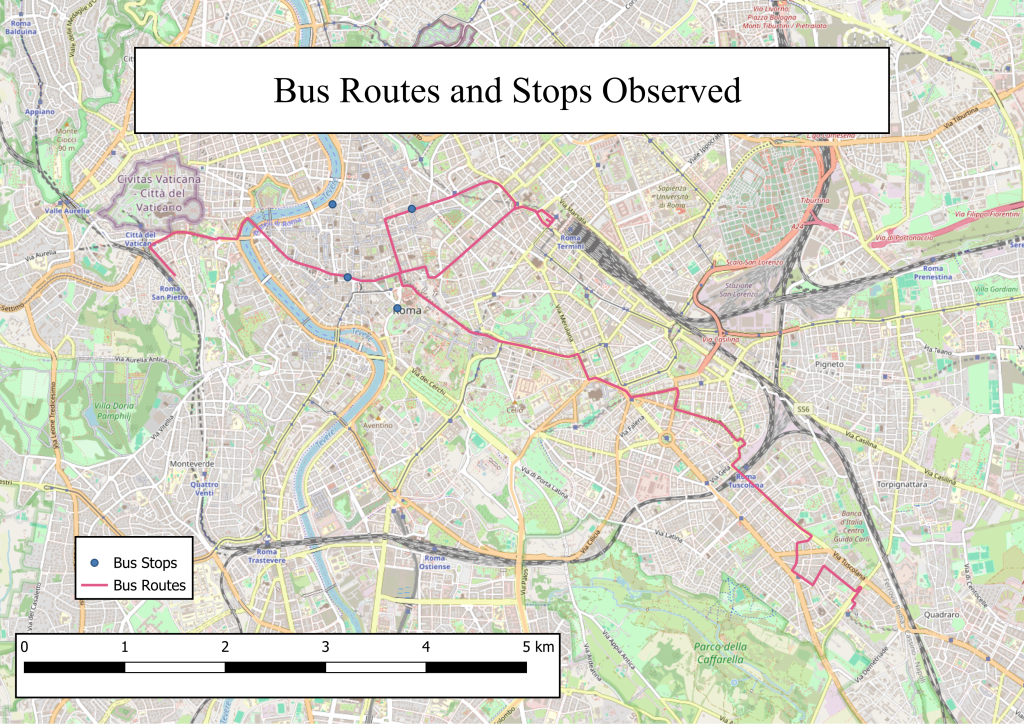
For each stop selected, I stood at the stop for a period of roughly 45 minutes, and for each bus that arrived I wrote down the route number and the time of arrival. Because there is no time table to compare the arrival times to, I had to get creative. The time between arrivals of one route can be compared to the expected frequency. This is one of my metrics for delay. For example, I observed the Tritone (Fontana Trevi) eastbound stop. The data for this observation period is listed below in Table 1.
| Tritone (Fontana Trevi) Eastbound 9/15/2026 From 5:10-5:50PM | |||
| Arrival Time (PM) | Route | How Long Since Last Arrival (minutes) | Route’s Expected Frequency (minutes) |
| 5:13 | U 62 | N/A | 12 |
| 5:13 | U 83 | N/A | 15 |
| 5:19 | U 53 | N/A | 15 |
| 5:19 | U 160 | N/A | 20 |
| 5:22 | U 117 | N/A | 15 |
| 5:22 | U 117 | 0 | 15 |
| 5:25 | U 492 | N/A | 12 |
| 5:28 | U 85 | N/A | 12 |
| 5:34 | U 71 | N/A | 12 |
| 5:34 | U 71 | 0 | 12 |
| 5:35 | U 63 | N/A | 15 |
| 5:35 | U 85 | 7 | 12 |
| 5:38 | U 62 | 25 | 12 |
| 5:39 | U 117 | 17 | 15 |
| 5:46 | U 492 | 21 | 12 |
| 5:49 | U 71 | 15 | 12 |
From this data a few conclusions can be drawn: the 492 and the 62 are obviously delayed, and the 117 and 71 have become platooned; the routes come in waves. For the 492 and the 62, the actual frequency is almost double the expected frequency. For the 117 and the 71, two coaches arriving at the same time indicates highly variable travel time on the corridor, which can lead to slowdowns. Also, oftentimes four to five coaches would arrive in a short span of time, which leads to issues fitting all of the coaches at the stop. Based on this information, we have a starting place to determine the causes of delay. Singling out routes allows for further investigation, but even at this early stage, delay generators can be observed, such as the buses crowding the stop. The next stage of my observations was riding the length of multiple routes.
To get a better understanding of the delay a coach accrues on its journey, I rode multiple routes that I identified in the previous section. The U 64 and the U 85 were the routes I selected for further analysis. I rode the entire length of each route, measuring the amount of time the bus travels between each stop. This data was then collated into a table, which could then be used to demonstrate chokepoints in the route (Table 2).
| U 64 Termini to Stazione S. Pietro Observation 9/17/2026 5:06-5:48 PM | ||
| Stop Name | Time of Arrival (PM) | Time to Next Stop (minutes: seconds) |
| Termini | 5:06 (expected at 5:02) | 3:58 |
| Repubblica | 5:09:58 | 1:57 |
| Nazionale (Torino) | 5:11:55 | 1:32 |
| Nazionale (Quattro Fontane) | 5:13:27 | 1:42 |
| Nazionale (Palazzo Esposizioni) | 5:15:09 | 2:03 |
| Nazionale (Quirinale) | 5:17:11 | 12:26 |
| Plebiscito | 5:29:37 | 1:55 |
| Argentina | 5:31:32 | 1:04 |
| C. SO Vittorio Emanuele (S. A. Della Valle) | 5:32:36 | 1:39 |
| C. SO Vittorio Emanuele (Navona) | 5:34:15 | 2:11 |
| C. SO Vittorio Emanuele (Tassoni) | 5:36:26 | 1:24 |
| Ponte Vittorio Emanuele | 5:37:50 | 2:27 |
| LGT Sassia (S. Spirito) | 5:40:17 | 3:28 |
| Cavalleggeri (S. Pietro) | 5:43:45 | 4:15 |
| Stazione S. Pietro | 5:48 | N/A |
Using this table, it is apparent that there is a significant chokepoint between Nazionale (Quirinale) and Plebiscito. Because I rode the route, I know that sharp curves combined with high volumes of traffic cause this choke point.
Sources of Bus Delay
After tracking the arrival of buses and riding routes searching for chokepoints, I came up with the following categories. Sources of bus delay can be sorted into four causes: geometric constraints, congestion, boarding, signals. Some of these factors cause a bottleneck at a specific intersection, while others consistently slow the bus down throughout a corridor.
Geometric Constraints
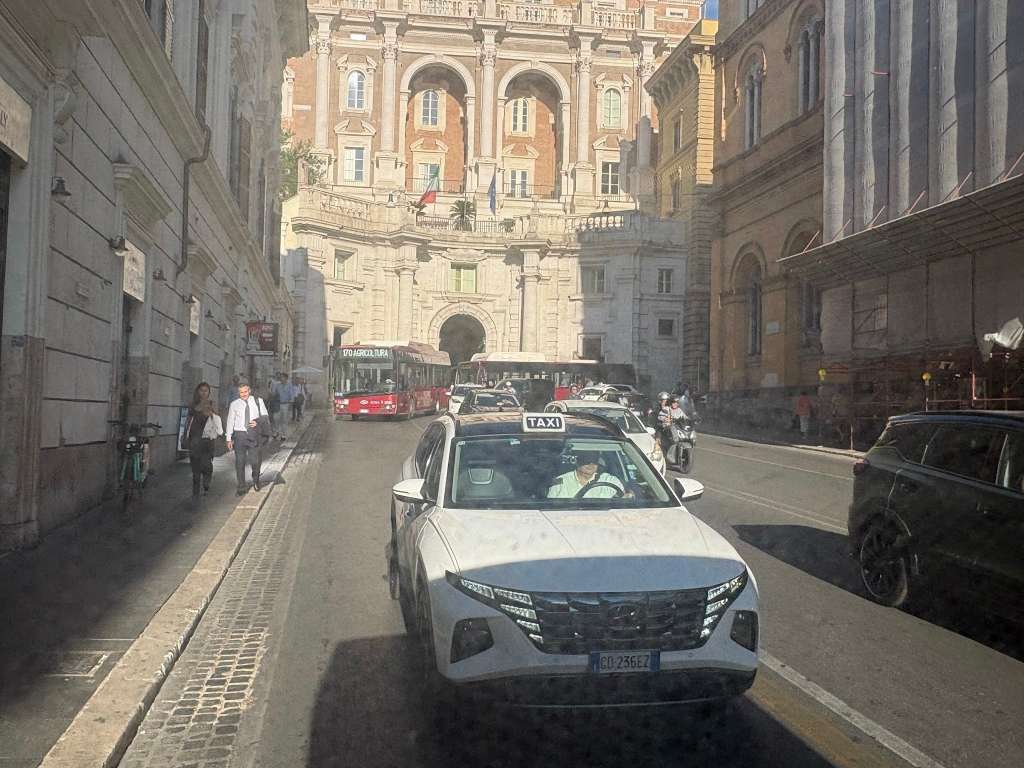
ATAC’s bus network generally stays on large straight roads, but even so there are geometric constraints that cause the bus to struggle. The vast majority of buses on Rome’s roads are 40’ coaches, which have the worst turning radii of any class of bus. Even though 60’ coaches are longer, the articulated section allows for an equal or smaller radius to a 40’ coach. The coaches ATAC uses are not very maneuverable, especially compared to the other vehicles on the road. An example of a location in Rome where the bus struggles is the 90 degree curve that Via Nazionale makes just east of the Largo Magnanapoli roundabout. The U 64 must straddle both lanes to successfully make the movement. This chokepoint causes the bus significant delay. I collected travel time data at this location, and the bus takes just over twelve minutes to complete this maneuver. In Figure 4 the problem can be observed.
Another problem spot is on Via del Teatro, just east of the Monument to Vtitorio Emanuele. The U 170 heads northbound here. The road width quickly shrinks from roughly 25 meters to 12, creating a bottleneck for both people driving cars and buses. Because the buses are less maneuverable than other vehicles on the road, smaller cars are able to cut in front of the bus, shown in Figure 5.
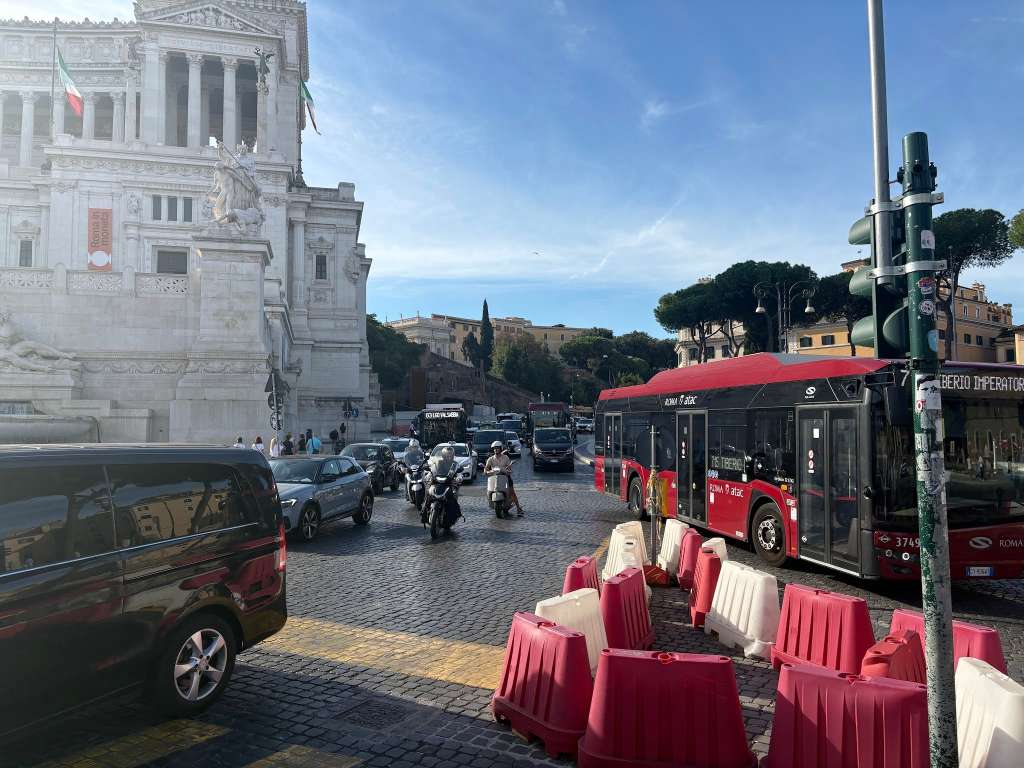
These chokepoints force the bus operator to change tactics and slow down to avoid a collision. An important note about geometric constraints is that they are always navigable for the bus—no transit agency would try to send a bus through a maneuver that is physically impossible. These problem spots are simply areas that the bus has to slow down significantly to travel through. Often, the reason that these areas give the bus a challenge is due to the combination of harsh geometry with high volumes of people driving cars.
Congestion
Congestion slows down buses. It is important to note that Rome in specific has a significant congestion problem. Gullota et al. demonstrate that the entirety of the city center, as well as multiple surrounding neighborhoods, experience the equivalent of Level of Service D, E, or F throughout most of the day. A “lack of serious planning” in addition to lax zoning ordinances have created a massive volume of people driving into the city center every day (pg. 557). Naturally, if cars fill up the street, buses cannot travel along it (Figure 6).
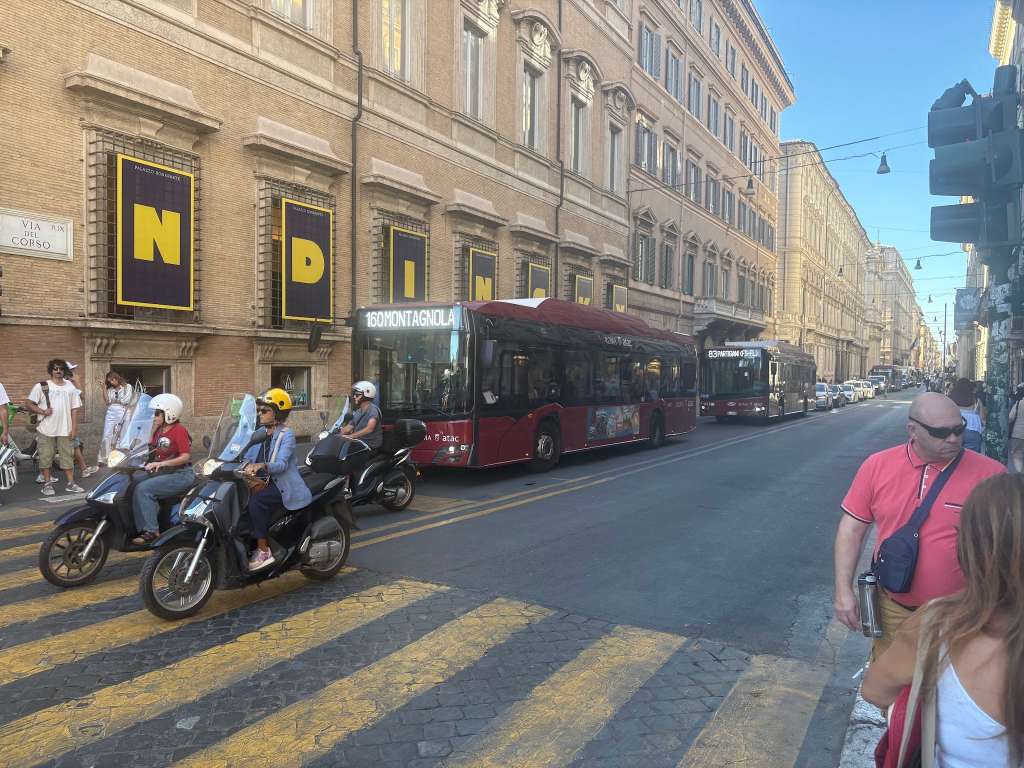
Bus Stops
Buses also must stop to allow passengers to board and alight. The time a bus spends at a stop is generally not considered when determining sources of delay, but certain factors lead to ATAC buses spending excessive amounts of time at bus stops. Buses are often crowded, which means that people can struggle to board or alight. The placement of the fare machines and the time it takes to pay leads to crowding around the fare machines. Because the machines are near the front and the back of the bus, people do not continue into the center of the bus, instead they stop to pay, leading to a line forming, which can extend outside the bus. Also, buses can become platooned (Figure 7).
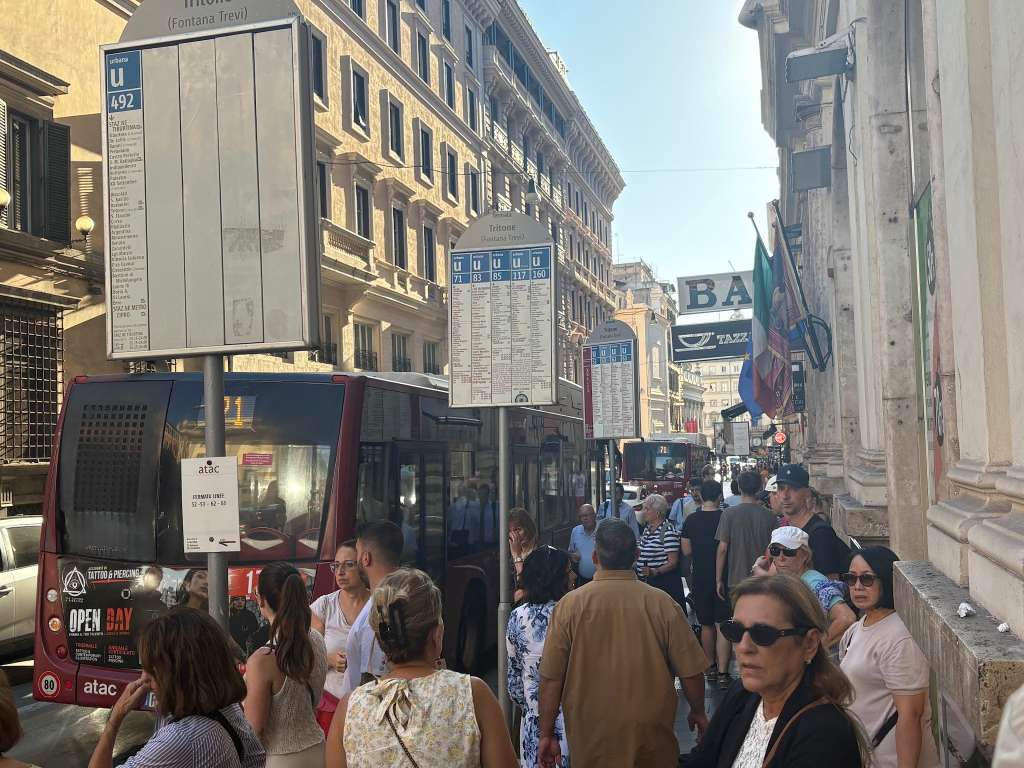
Platooning is when delays cause coaches on the same route to catch up to another, which leads to uneven departing loads–effectively wasting the second coach. Platooning can also ruin the expected frequency of a route. Another issue that can be observed at stops is bunching. Because most routes in Rome stick to the main thoroughfares, they end up duplicating service on those roads. This means that on roads like Corso Vittorio Emanuele II, there are eight to ten different routes using the same stops. This high volume of buses means that often multiple buses are attempting to serve the same stop at once (Figure 8).
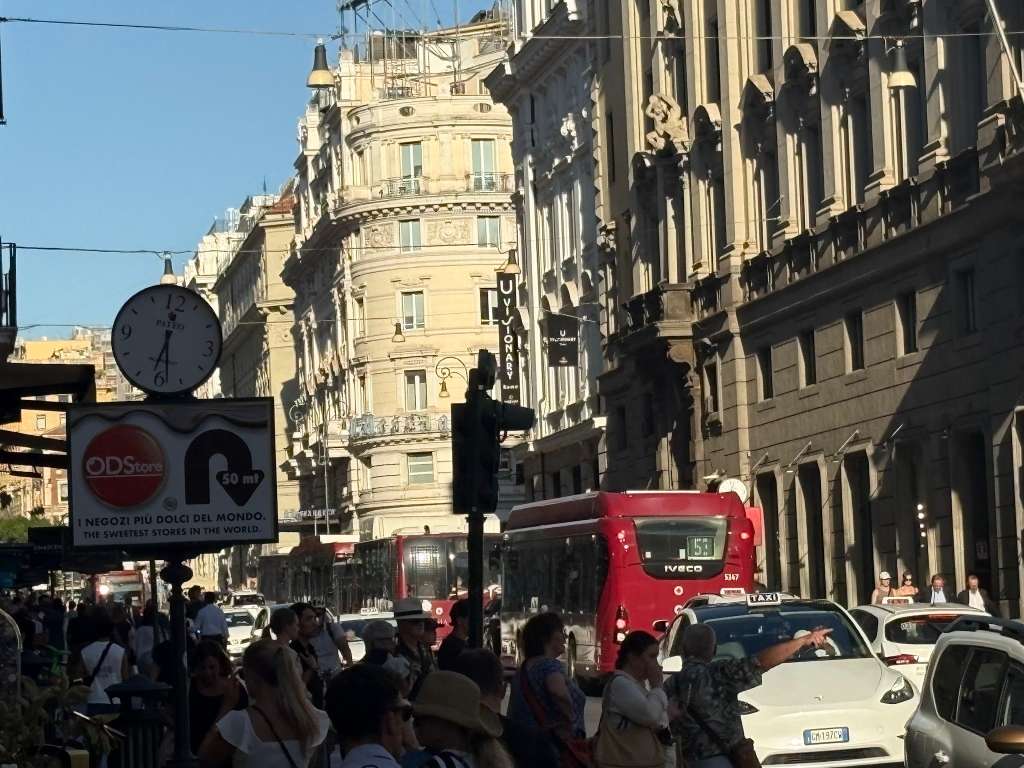
While this behavior does not have the same implications of reduced frequency as platooning, only so many buses can serve the stop at once. Generally, I observed that the clear area for a stop in Rome can accommodate two buses. If more than two buses arrive at a stop together, the coaches in the back must wait for the first two to board and alight, then they can move forward and take their turn.
A rare but significant form of delay occurs when the stop pulls the bus out of the flow of traffic. When a bus stop is located in a parking lane, or an oversized general purpose lane, the act of the bus serving the stop allows traffic to pass the bus. This prevents the bus from re-entering the lane, as cars are flowing past them. For example, in Figure 9, the lane leading up to the intersection is massive, and can easily fit two cars side by side. The receiving lane across the intersection is not, so buses are forced to merge through the intersection to continue past the stop.
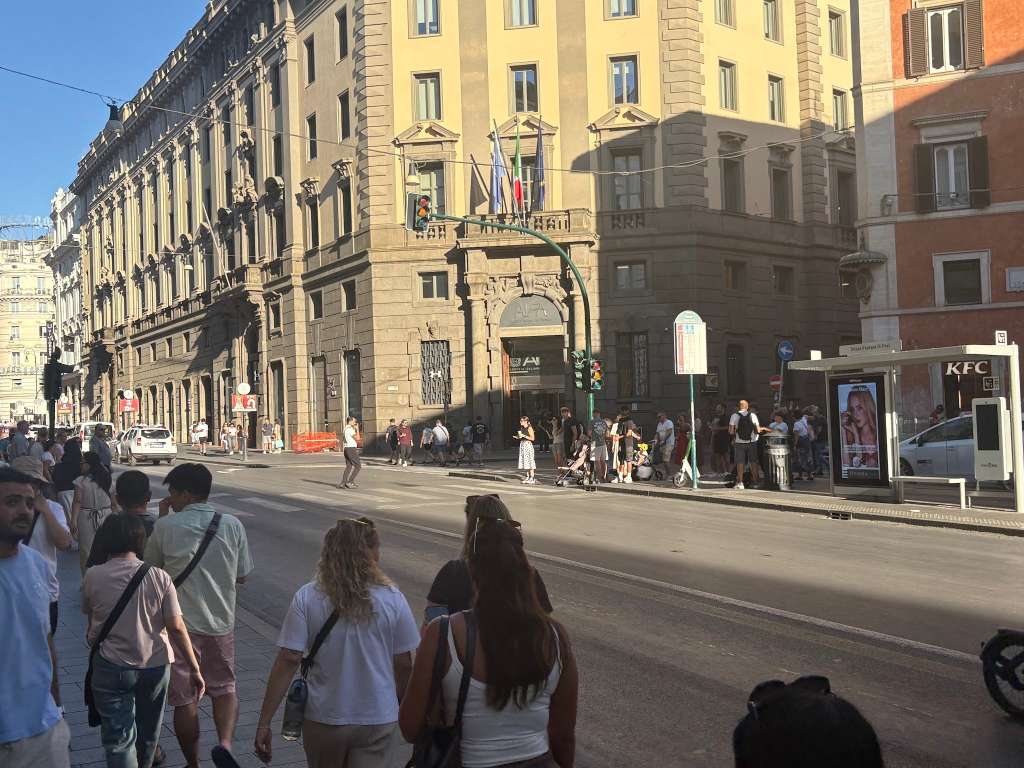
Finally, the last significant source of delay that occurs at bus stops is when a nearside stop causes a coach to miss the green, forcing the bus to wait through the entire cycle. ATAC does not appear to have a preference for nearside or farside stops, instead choosing the location based on factors specific to each location. In any city, a nearside stop has the potential to lengthen the time a bus spends at a stop, especially if the cycle lengths are long. One instance of any of these sources of delay at bus stops does not have major ramifications for the travel time of a coach, but when these problems are repeated at multiple stops along a route, or are combined with other sources of delay, they can significantly impede the speed of a route.
ATAC’s Solutions
ATAC is aware of these issues, and has been installing improvements targeted at improving chokepoints throughout the city. The municipality of Rome also has their own plans for prioritizing alternate modes of transportation, aiming to get cars off of Rome’s streets.
Bus lanes are utilized throughout the city, and more are planned. On roads with two or more lanes in each direction, installing a bus lane can improve both bus travel times and general purpose traffic (hereafter referred to as GP traffic) travel times (Russo, 2022). In Rome in specific, installing a bus lane on a road reduces the average bus travel time by one minute for every kilometer traveled, and reduces the average GP traffic travel speed by 0.20 minutes (Russo, 2022). Separating the two different modes allows each to move unimpeded by the other–buses do not have to deal with congestion, and GP traffic does not have to wait behind buses when they stop (Figure 10).
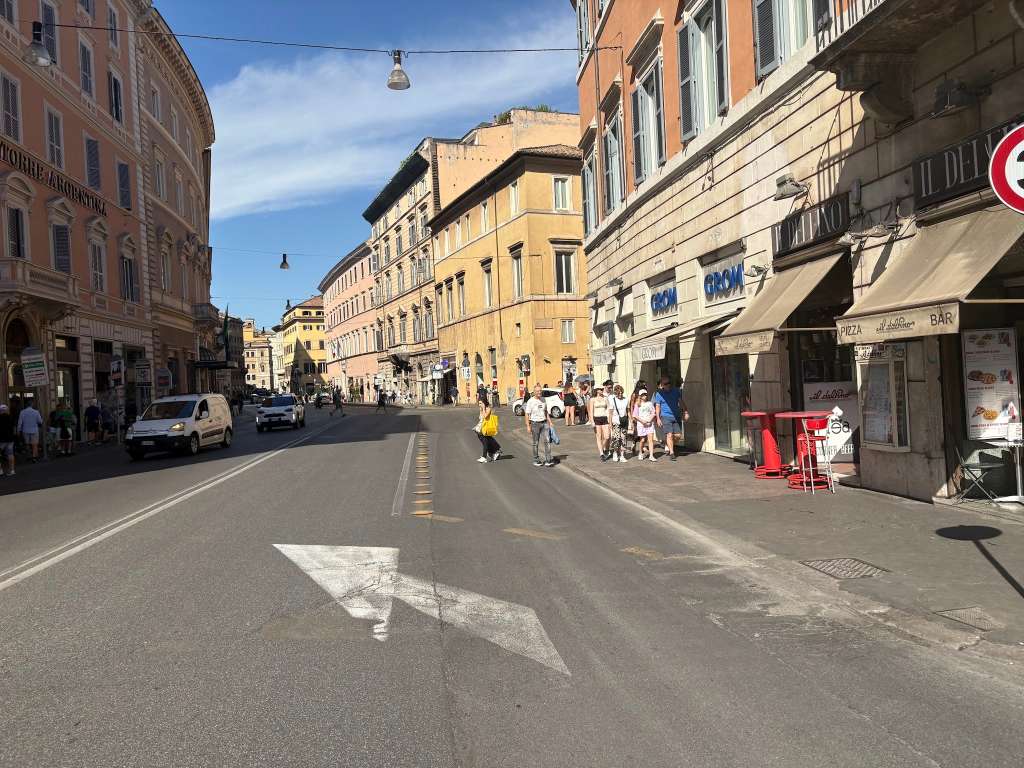
The main issue with bus lanes in Rome is that–like many other European cities–buses share these lanes with taxis. The problem arises when taxis stop to pick up or drop off passengers, blocking the lane. Compliance is no longer a problem in Rome, as they installed many traffic cameras along 22 corridors to ensure that people driving cars follow the rules (Mobilita Roma, 2023). What prevents bus lanes from being utilized throughout the network is that many of the roads do not have the necessary right-of-way width to accommodate both a GP lane and a bus lane in both directions. Also, a road may have adequate width for one block, but the size of the road is prone to changing drastically along a corridor. Because of this, Rome has two other solutions to improving delay.
A solution to this problem unique to Europe are Limited Traffic Zones (hereafter referred to as LTZs). LTZs are a restriction on vehicular traffic in certain areas, “but they do not prohibit all cars, as in pedestrian zones, and you cannot buy your way in, as with tolls or congestion pricing. The primary goal is livability not revenue” (Biggiero, 2014). In practice, this is a collection of city blocks surrounded by signage dictating when and who can enter (Figure 11).
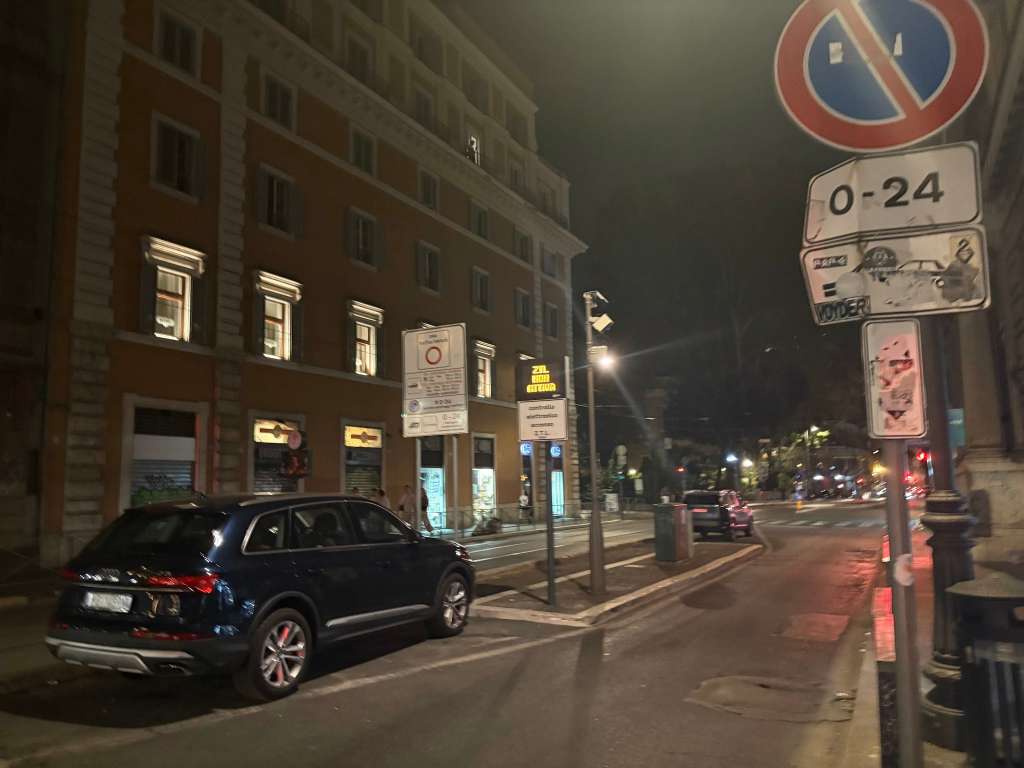
Buses are allowed to travel freely in Rome’s LTZs. Because LTZs decrease congestion, they can improve bus travel times, in addition to their main priority of reducing emissions and improving the pedestrian experience. LTZs seek to improve upon the concept of congestion pricing. Congestion pricing disproportionately affects those of a lower socioeconomic status, acting akin to a tax or toll. LTZs do not charge money to enter, instead permits are given to those who live or work in the affected zone.
The last method that ATAC has implemented to speed up the bus is allowing all door boarding. A recent experiment, all door boarding seeks to improve the efficiency of boarding by allowing people riding the bus to enter at all of the doors. Instead of one long queue for the first door, both the first and the last doors are equipped with fare machines, and all doors open whenever the bus stops. In addition to this, ATAC 40’ coaches also have three doors, compared to the American standard of two doors, which allows for a substantially quicker boarding experience. The problem with all door boarding on ATAC buses is that there is no fare machine for the middle door, meaning that passengers are less inclined to use that door. Also, the machines are slow, meaning that often there is a queue extending out of the doors.
ATAC has slowly been implementing improvements meant to speed up the bus. Not one of these upgrades is the most effective, as each has been used in unique locations to solve problems the other methods cannot. Bus lanes have been proven to dramatically increase the speed of the bus, but not every road can handle a bus lane. LTZs can help relieve congestion on narrow streets in the city center. All door boarding can reduce the amount of time a bus spends at a stop. Together, these improvements have been working to speed up buses throughout Rome.
Comparison to King County Metro’s Route 8
To get a better understanding of causes of delay and the resulting improvements in Rome, a comparison to a King County Metro (hereafter referred to as KCM) is valuable. Comparing and contrasting the context that buses travel through in Rome to a place I am familiar with will give me a better grasp of the bus network in Rome. Examining the changes to the street that each municipality made will allow me to learn about different ways to improve transit delay. KCM’s Route 8 is a perfect route to analyze side by side to the routes that I rode in Rome.
The 8 was the most delayed route in KCM’s network. The route was so slow that it was nicknamed the “L8” (late). I took part in a protest, where myself and a hundred other Seattle transit fans walked Denny Way, racing a route 8 coach (Figure 12). We won.
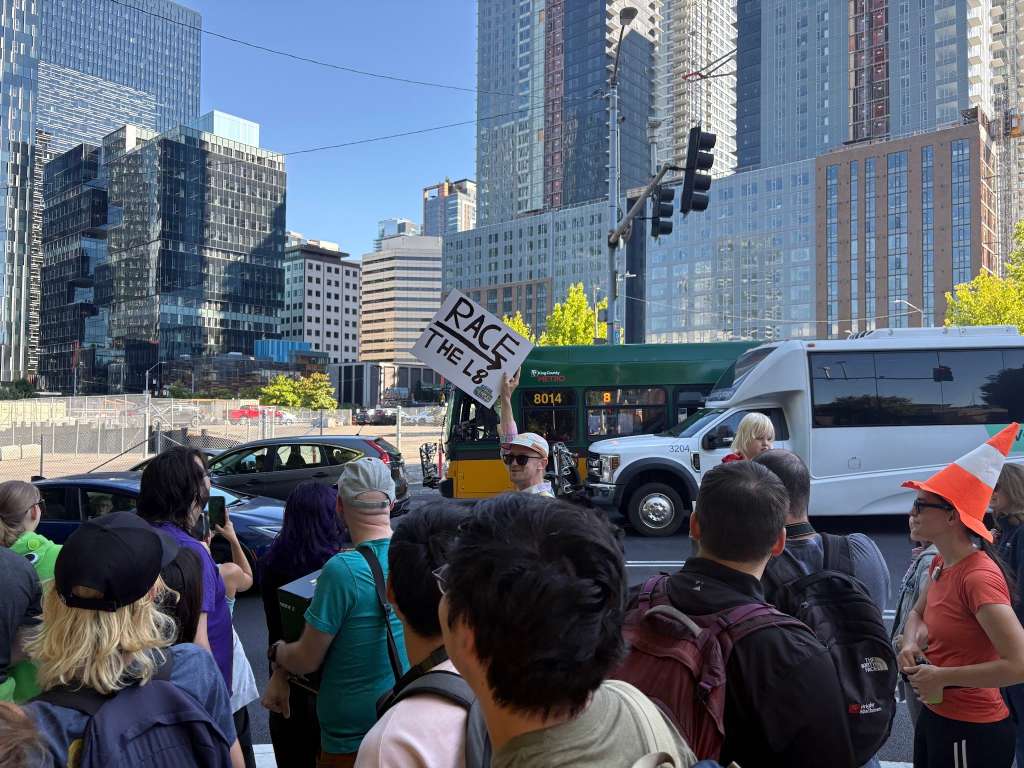
Obviously, this route was delayed. A myriad of locations and constraints caused this. The route struggled to turn onto Denny Way from Queen Anne Ave, due to long queues and the sharp geometry of the turn. On Denny Way itself the bus struggled, as the curbside lane was filled with traffic heading for I-5. The center lane was practically empty, but the bus needed to travel in the curbside lane to pick up passengers. This led to the bus sitting in a gridlock, all along Denny. There is also substantial congestion in the Capitol Hill neighborhood, as well as narrower streets, leading to difficulties turning.
Comparing the sources of delay between routes I rode in Rome and the 8, I see a common theme of congestion compounding with geometric constraints. In Rome, difficult turns and roads that narrow dramatically cause problems for coaches, but congestion worsens the problem. The curve mentioned above on Via Nazionale or the narrowing road mentioned above leading to Piazza Venezia would not be significant choke points without the high volumes of traffic. This is similar to Denny Way, where the road itself should not cause the bus any issues, but adding the queue for I-5 causes complications. It is important to note that the geometric constraints are more substantial in Rome. In Seattle, the grid is effective enough that any suspect turns can be avoided by buses. In Rome, even the main roads can have difficult maneuvers baked into their path.
The Seattle Department of Transportation (hereafter referred to as SDOT) and KCM together planned a host of improvements, all aimed at alleviating the delay caused by the issues mentioned above. For example, to allow the bus to turn better onto Denny from Queen Anne, a short stretch of bus lane was installed to create a bus only left turn pocket. A bus lane was installed for most of the length of Denny Way, and at any sections where the width prevented the installation of a bus lane, a queue jump was installed at the intersection before the bus lane ended. A queue jump is a bus signal placed at an intersection that triggers before the green in the cycle. This allows the bus to jump in front of GP traffic. The GP traffic route to I-5 was rerouted off of Denny Way, and signage was installed, attempting to divert traffic. Many of these improvements were just installed at the end of August.
Both Seattle and Rome utilize bus lanes as a primary method to relieve bus delay, but Rome is far more constrained in where they can install them. There is enough right of way on the vast majority of main thoroughfares in Seattle to install a bus lane, which is not the case in Rome. To improve the 8, bus lanes were painted on the majority of Denny Way. ATAC’s U 64 has bus lanes on Corso Vittorio Emanuele—for a time. The difficult turn in Rome mentioned above does not have the width to install a bus lane. Corso Vittorio Emanuele also narrows as it travels west, and eventually the bus lane ends. Rome also does not utilize queue jumps, whereas SDOT installs them throughout the city. SDOT does not have the legal ability to create LTZs, however. There are many high congestion zones in Seattle that would benefit from such a treatment. Each of these treatments are effective in different contexts. An LTZ may cause too much political ill will in America—where everyone must be able to drive wherever they want to go. A queue jump may be taken as a green light by Italian drivers, which could cause conflicts with the bus.
Reflections and Personal Opinions
Having now analyzed ATAC’s bus network in the city center, I feel that the perceived delay is much worse than the actual delay. The buses run fairly regularly, the frequency is for the most part quite high. But, when you are on the bus, it is obvious that the travel time can be large, that the bus is moving slowly. Looking at the data I collected while waiting at the bus stops, for the most part the actual frequency is quite close to the expected frequency. The issue is the chokepoints where the bus gets stuck. The places I mentioned, like the road leading to Piazza Venezia, or the curves on Via Nazionale, cause the bus to grind to a halt. Many of these areas are difficult to solve. Because the geometry is already narrow and winding, installing a bus lane is tricky, and the channelization has to match the curve of the roadway.
In my mind, the geometric constraints would lead to signal improvements, yet Rome does not utilize queue jumps. There are many abnormal intersections, where more than two roads meet, or meet at strange angles. At these locations, giving the bus extra time to move before GP traffic would ease the operation of the intersection. Perhaps ATAC has a policy against queue jumps, but I could not find any information about them. Also, in my opinion, allowing taxis and rideshare vehicles in bus lanes slows down buses. Rideshare vehicles haphazardly stop, almost at random, and they sit in the bus lane. No matter my opinion on their methods, experiencing a different country’s premier transit system has been incredibly valuable.
I have learned so much from riding ATAC’s buses. Each city has a unique history, which shapes how the grid and roads develop. The beauty and the fun of working on a bus network is figuring out how to connect a city, while paying attention to its history. Subways and rail require either tunneling beneath, or building above the city. Buses operate on the ground, and–in Rome–on paths that have been traveled for millenia. I will take what I have learned here–the power of LTZs and bus lanes, the reverence and respect for the history of a place–and apply it in my life in Seattle. I have never been so thankful to live in a city with a grid, but I will never forget when I rode the buses of Rome.
Reference List
Azienda Transporti Autoctoni Comunal. (2018). Carta dei Servizi del Trasporto Pubblico e della Sosta Atac 2018. https://www.atac.roma.it/docs/default-source/pubblicazioni/carta-dei-servizi-del-trasporto-pubblico-e-della-sosta-atac-2018.pdf?sfvrsn=f6ff5f33_4
Biggiero, L. (2014). The impact of Transport Management on the local activities system: The role of Limited Traffic Zones. WIT Transactions on The Built Environment, 1, 669–678. https://doi.org/10.2495/ut140551
Citta Metropolitana Di Roma Capitale. (2022). Piano Del Trasporto Pubblico Del Bacino Metropolitano (PdB): Il Quadro Conoscitivo. https://pums.cittametropolitanaroma.it/sites/default/files/inline-files/21_PdB_Quadro%20Conoscitivo.pdf
Cipriani, E., Mannini, L., Montemarani, B., Nigro, M., & Petrelli, M. (2019). Congestion pricing policies: Design and assessment for the City of Rome, Italy. Transport Policy, 80, 127–135. https://doi.org/10.1016/j.tranpol.2018.10.004
Gullotta, G., Loret, E., Stewart, C., & Sarti, F. (2020). Traffic attractors and congestion in the urban context, the case of the City of Rome. Journal of Geographic Information System, 12(06), 545–559. https://doi.org/10.4236/jgis.2020.126032
Preferential lanes, new cameras activated to monitor traffic Mobilita Roma. (2023). https://romamobilita.it/primo-piano/corsie-preferenziali-dal-95-nuovi-occhi-elettronici/.
Moovit Public Transit index. Moovit. (2022). https://moovitapp.com/insights/en/Moovit_Insights_Public_Transit_Index-countries.
Russo, A., Adler, M. W., & van Ommeren, J. N. (2022). Dedicated bus lanes, bus speed and traffic congestion in Rome. Transportation Research Part A: Policy and Practice, 160, 298–310. https://doi.org/10.1016/j.tra.2022.04.001
Turismo Roma. (2020). 100 for the Center: Rome has a New Electric Bus Line. https://www.turismoroma.it/en/news/100-centre-rome-has-new-electric-bus-line.