


Rome’s Ancient RoadsDarcy Akers (2013)
1. Introduction
Anyone who experiences the frustration of driving in a downtown gridlock knows the importance of traffic management. Especially in cases of densely populated urban areas, traffic management, not the construction of new roads is the cost-effective method for handling traffic and reducing congestion. The deep history and ancient infrastructure in Rome presents a difficult challenge to modern traffic managers. Historically, Romans have possessed enough city planning and engineering knowledge to manage traffic in Ancient Rome. Now, however, Roman engineers are presented with a different challenge of adapting the same ancient infrastructure to handle a much larger capacity of vehicles. By looking at the application of three technologies that manage traffic without making significant changes to the ancient infrastructure, this paper will illustrate the how well Rome is adapting to using modern technologies.
Traffic management encompasses a broad range of technologies and systems to control the mobility of vehicles. According to Hasan & Yaz, the goals of traffic management are to minimize cost, act environmentally, minimize public spending, improve quality of life, increase efficiency, and enhance safety (1999). These goals can be accomplished by employing advanced technologies, as well as comprehensive systems that improve the operation of roadways and other transport systems. Projects like installing variable message signs, restricting traffic in certain areas, automatic toll collection, and pedestrian friendly corridors are just a few examples used in urban areas. Some techniques are physical changes in infrastructure, like one-way streets or speed bumps, and others are unobtrusive and digitally controlled, like signal timing and variable message signs that show regional travel times. Traffic management doesn’t just encompass keeping vehicles moving on the road. It also includes parking systems, HOV lanes, toll roads, and more to regulations that improve overall mobility. Many large cities will employ multiple techniques to tackle traffic management and ease their congestion woes and this paper will examine a few of the methods used in Rome.
2. Background
Romans have long been credited as the first builders of modern roads, which also makes them the first road managers. As Rome expanded its empire in the Republic Era of sixth century BC, road building became a major part of military conquests. The first all-weather roads, which connect the capital to the newly conquered areas, were well-built and constructed with an efficiency that puts modern highway construction to shame. Examples of well-known 3rd and 4th century roads include the Via Latina, Via Appia, and Via Falmina (Berechman, 2002). Roads were vital for Rome’s economic and social success because they eased the movement of goods and people for both military and general purpose and increased interregional trade. According to research done by Joseph Berechman on Roman highway development, “by the 2nd century AD, there were over 85,000 km (53,000 miles) of roads within the empires borders, and over 13,600 km (8,500 miles) within Italy” (2002).
The construction of ancient roads showed that the Romans had advanced understanding of engineering. The construction of roads took place in two phases. First, the actual route design and surveying – which introduced many straight sections of roads that only curve for some mountainous terrain and natural barriers. In many cases, Romans planned the route of the road so they could paved their roads on top of existing Etruscan dirt paths and thus improved mobility very efficiently. The second phase was the actual construction of road which can be summarized as: “drainage, excavation, filling and paving” (Berechman, 2002). The materials of Roman roads often depended on the region, but generally included edge stones, a bottom foundation of mid-sized rock, a middle soft layer of sand or mortar and a surface layer of large paving stones. Some engineering techniques employed in construction were parallel drainage ditches, embankments called “Agger” to prevent flooding of the roads, and grooves engraved in steep sections to prevent soldiers from slipping (Berechman, 2002). In general, the engineers of Rome were designing the highway system in a “hub-and-spoke” network pattern, which is one of the reasons we have the famous phrase “All roads lead to Rome”.
The early management of Roman roads was partial driven by social and economic factors. For example, the milestones that were used to mark distances were primarily installed to recognize the emperor or consular who commissioned the road. In some areas, transit tolls were used to raise revenues, a traffic management technique still used in modern Rome. The rates averaged around two percent of the value of the goods being transported and were collected at borders of different districts (Berechman, 2002). Interregional trade eventually became an important factor in the construction of roads around Rome because, as Berechman establishes in his paper, “Romans derived real economic benefits from their roads” (2002). Therefore, Romans took care to maintain their roads and ensure not only easy transport of troops, but also of goods.
Roman city planners incorporated many different types of traffic management as they laid out the Rome and the infrastructure of other cities within their empire. For example, sidewalks were built about one and a half feet higher than the road as a “precaution to prevent vehicles from accidentally rolling into the path of pedestrians” (Macaulay, 1974, p. 42). Since the roads were lower than the sidewalks, they had “stepping stones” for people crossing the streets. These stones also functioned as a type of speed bump because carts and animals made to go slowly when traveling around them. They also had restrictions on where carts could go and, in some areas, carts and chariots were banned during the day because there were so many people walking around. Also, in residential areas, Romans sometimes built one-way or dead-end streets so there would be less noisy traffic passing through (Macaulay, 1974). While the ancient methods of traffic control can still be found in many places throughout Italy, the focus of the rest of this paper will be on some of the traffic management techniques Rome is utilizing now that incorporate modern technologies.
3. Current Traffic Management
To understand the current scope of traffic management in Rome, it is important to understand Rome’s density and complicated urban fabric. Rome spans roughly 1,285 square kilometers and has more than 2.8 million inhabitants and 1.1 million workers in the city center (ICT-Emissions, 2013). In a 2013 study done by ICT-Emissions, it was estimated that there are 6 million trips made during a normal work day. Around 60 percent of vehicles are private and morning peaks see “a very intense flow [of traffic] heading to the city centre”. However, the gap between private and public transit, which is around 25% in the greater metropolitan area, has been closing in recent years (ICT-Emissions, 2013). The layout of Rome is the same ancient times, with many of the roads head of radially from the center. The Grande Raccordo Anulare, or the GRA, encircles Rome and is the major non-tolled highway in the metropolitan area of Rome.
Nowadays, major cities utilize some type of Intelligent Transportation System (ITS) as part of their traffic management plan. As stated before, the goal of traffic management is to improve the safety, viability and quality of a transportation system. ITS helps accomplish these goals in a way that is often cost effective, environmentally friendly and unobtrusive. ITS encompass a broad range of technologies: wireless communications, automatic vehicle recognition, loop detection, Bluetooth detection and other video and sensorial technologies. The applications of these technologies include emergency notification systems, variable speed limits, signal coordination, express toll collection, volume counts and more (Hasan & Yaz, 1999). Urban Traffic Control (UTC) uses a variety of systems to manage densely populated areas, including collection data of Urban Travel Times (UTT) and creating a coordinated signal systems based on factors such as time of day, day of week or traffic volumes. Many modern cities turn toward ITS to manage vehicles cost efficiently, and Rome is no exception.
Traffic management in Rome is important for handle the sometime overwhelming level of traffic that pours into the city center. By looking at some of the traffic management techniques currently used, we will be able to draw a rough picture of traffic regulation in Rome, or lack thereof. The following sections will further illustrate three traffic management techniques currently used in Rome and their implication and impact. The topics are: Limited Traffic Zones, Parking Meters, and Signal Coordination.
3.1 Limited Traffic Zones
3.1a Implementation
In 1989, Rome implemented a new system for reducing the number of cars in the central historic area called la zona a traffico limitato or a Limited Traffic Zone (LTZ). The purpose of the traffic management program was to unclog the streets and create a more pedestrian friendly center. The area is controlled by more than twenty access points (Figure 7) and vehicles within these areas must have a permit or can be issued a €68 penalty. The zones have been changed and expanded since and modernized to keep up with advancing technology. In 2005, the LTZ was expanded to include Trastevere and some additional neighborhoods at night (Nussio, 2007). Currently, nearly 4.2 square km of Rome has some type of access restriction, which makes it the second largest urban area after London (Nussio 2007). The followings maps (Figures 1 and 2) show the daytime (yellow) and nighttime (blue) zones.


Retrieved from http://www.agenziamobilita.roma.it/en/ztl/ztl.html
At first the LTZ was controlled by paper permits, physical gates, and police-manned access points. However, this method required a great deal of resources, so an automated system – access control system (ACS) – was implemented in 1998. Once this system came online in 2001, a combination of “on-board units (OBUs), or transponders, and photo enforcement using automated number plate recognition (ANPR) software” were able to enforce the restriction and eliminate the much of the manpower previously needed (USDOT FHWA, 2006). Figures 3, 4, 5 and 6 show a ACS access point with a variable message sign, the cameras used for license plate recognition, and an informational sign that can be found around all around Rome. Traffic management tools such as cameras with plate recognition capabilities, variable message signs to inform motorist and different methods of traffic channelization are all utilized in this system.


The entire LTZ system is run by Azienda per la mobilità (ATAC), a private company that also runs the metro system in Rome. Residents and other drivers who want access in the city center must register through ATAC and pay the necessary fees. Non-residents, which compose 17 percent of all permit holders, must pay 340 euros annually. Additionally, all permit holders must prove they have access to parking (Figure 9). The ATAC issues around 150,000 permits annually (USDOT FHWA, 2006). Furthermore, in 1994, Rome expanded the LTZ and added the €68 penalty for violations. The fees and penalties together generate about 58 million euros in revenue. Like many other ITS programs, the annual operating cost is low, estimated around 3.2 million euros (Roma Mobilita, n.d.).

Retrieved from http://international.fhwa.dot.gov/traveldemand/t1_p08.cfm
3.1b Results and Impact
According to a case study done by the USDOT Federal Highway Association (2006), an evaluation of the area showed a decrease of between 15-20% in traffic flow volumes and an increase of 5% in public transit use. Results like this are promising, along with a low violation rate of 5-8%. The evaluation also reported no negative effect on business in the region and instead better accessibility for pedestrian traffic. These initial results follow what is desired by city planners – a less congested city center. Another part of the study found that moped and two-wheeled vehicles volumes increased over 10%. In field observations agree with a larger percent of mopeds in the LTZ than automobiles (USDOT FHWA, 2006).
A separate case study published by Eltis, an urban mobility portal, in 2007 showed similar results. Author Nussio reported “10% decrease in traffic during the day, 20% during restriction periods, and 15% in the morning peak” (Nussio, 2007). Similarly there was also an increase in two-wheeled traffic. The report also stated that the current ACS doesn’t allow recognition for two-wheeled vehicles so they generally don’t have permits. In traveling around Rome, one can observe the mobility of two-wheeled vehicles and speculate that it is possible for them to access the LTZ without passing through an access point and avoid the purchase of a permit. Both of these studies present a modal shift in the city center, with private vehicle levels around the same size a public transport and also a larger percent of two-wheeled vehicles and pedestrian traffic. Interestingly, this shift is only seen in the city center and not the rest of Rome.
Another result of Rome’s LTZ is a change in freight traffic and the delivery of goods. The STA, the Rome Mobility Agency, reported that in 1999, there were about 25,000 “goods” vehicles a day in Rome’s historic center and about two-thirds were on the roads in the morning (Stathopoulos, Valeri. Marcucci, Nuzzolo & Comi, 2013). These freight vehicles supplying goods to local shops can be owned either by the store, “own account transport”, or contracted by the store owner. In urban areas, it is typical for about 88% of freight vehicles to be “own account”, but in Rome the percent was closer to 54% in 1999. As a result of the LTZ and the ACS, there have been some noticeable changes in freight traffic. Contracted vehicles make up nearly 80% and many store goods are being delivered in smaller vehicles (Stathopoulos et al., 2012). It is possible that the €565 permit for large vehicles is discouraging shop owners to keep their own mean of transport and rely more on contracted vehicles. However, there doesn’t seem to be any change to improve in the efficiency of delivery. This side effect of trying to limit congestion is now being addressed by creating specialized restriction times for goods deliveries.
In the end, the LTZ plan to improve in Rome’s city center has also had an effect on pedestrian activity. The LTZ not only is a technique to reduce congestion, but also a tool to improve the livability of the area. More people are choosing to use alternative modes of transportation like walking or busing. Rome further restrict traffic in the city center by instituting pedestrian zones with signs like figure 8 below and also physical barriers. As mentioned before, pedestrian volumes increased from 1999 to 2007 by ten percent, which could be partially accredited to the restriction of traffic since it encourages people to walk and use public transit.


3.2 Parking
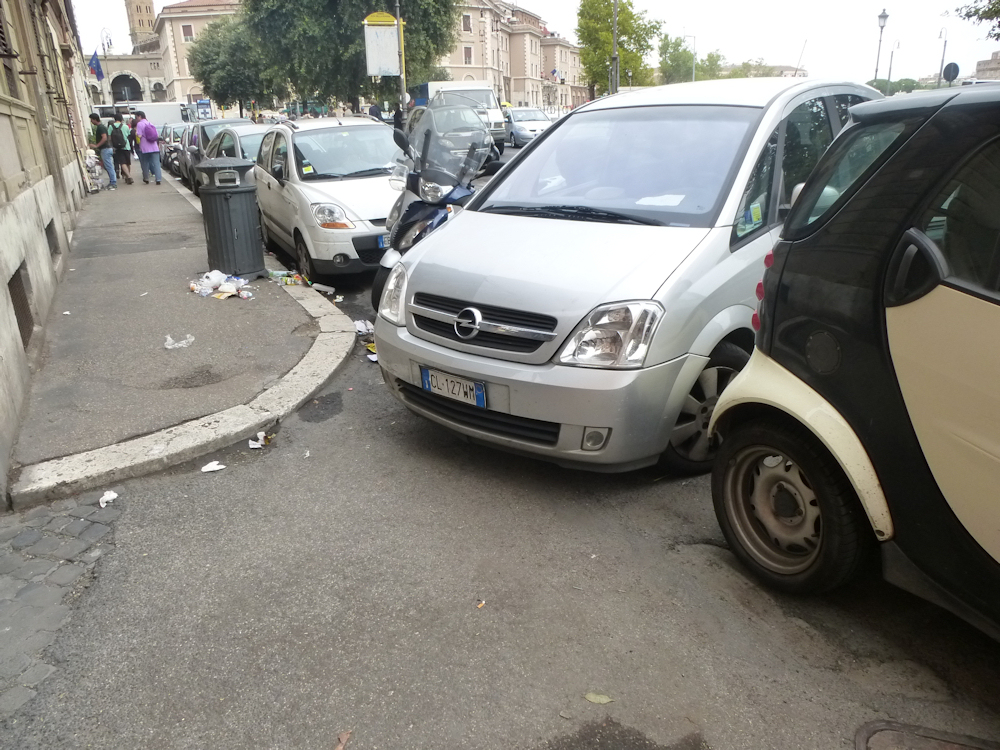
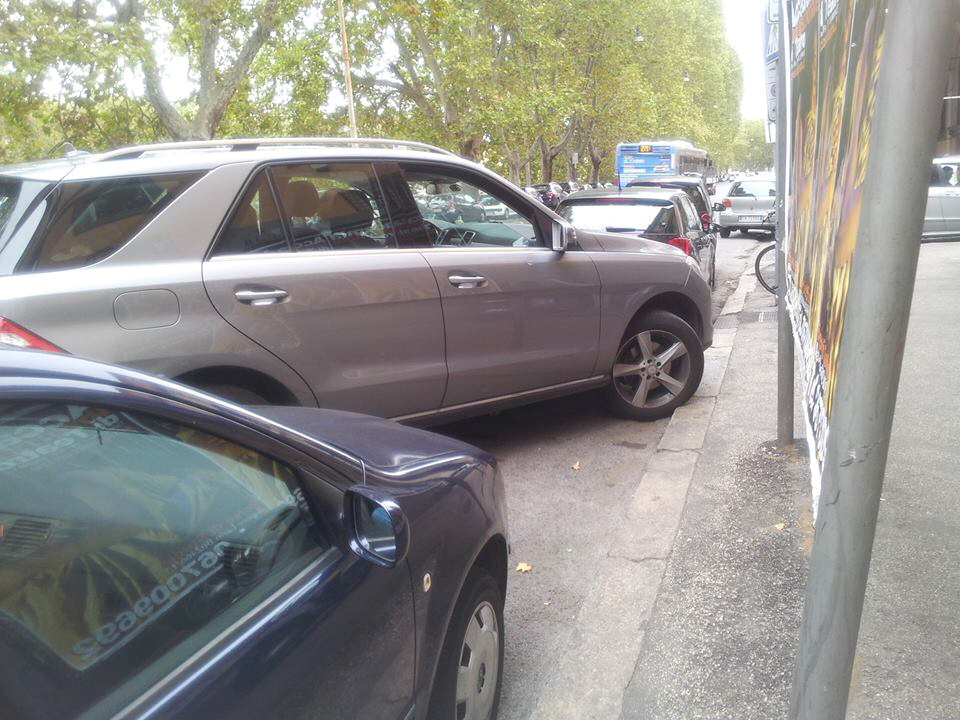
Walk down a side street in Rome and chances are you will see an illegally parked car blocking a pedestrian’s path or maybe just an entire block of scooters and mopeds. The combination of low parking rates, limited space and lack of parking enforcement hints at a poorly managed parking system. Rome has designed and filled in extremely densely, long before city planners were considering the need for parking spaces near the city center.
3.2a Parking Price and Availability
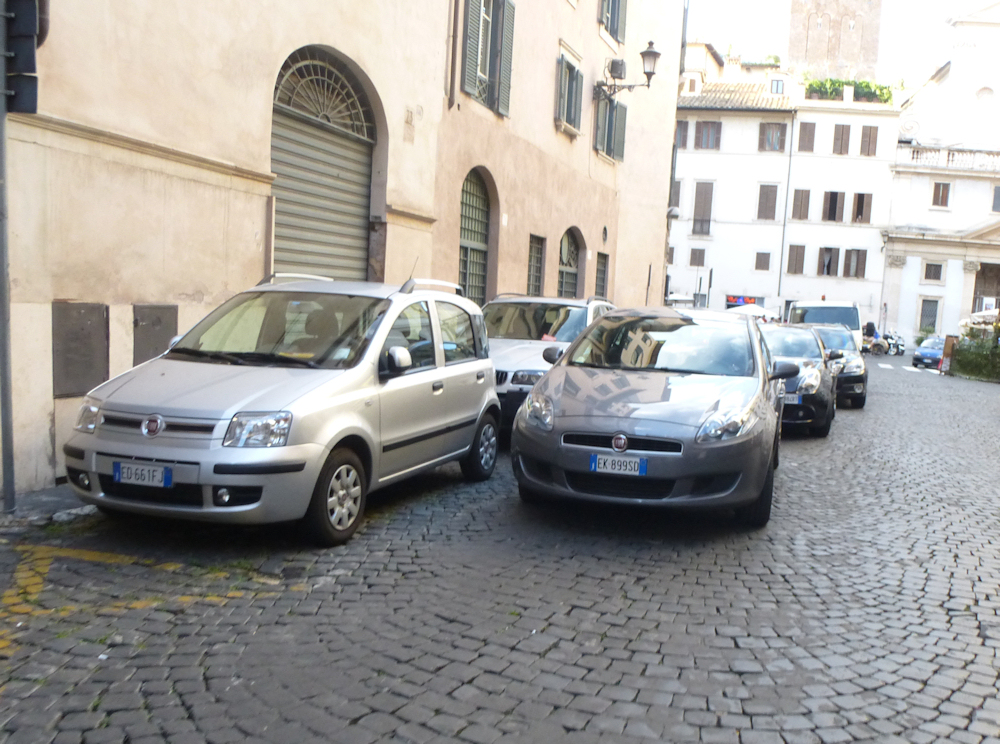
Rome is so tightly compact and densely populated that implementing a parking system is a difficult traffic management task. Currently, it is estimated that there are over 2.65 million vehicles in Rome and nearly 300,000 cars alone are driving during the morning peak hours (Cianofano, 2013). According to a 2006 case study done by the U.S. Federal Highway Association, Rome has around 65,000 on-street parking spaces. If you compare that to the 150,000 permits that are issued by ACAT for access in the LTZ, you can figure that only 43 percent of the cars have on-street parking. While some of the residential permit holders might have private parking available, the lack of parking garages and space leads to many problems including rampant illegal parking. While a majority of Romans drive small, compact cars or two-wheeled vehicles, Rome simply doesn’t have the capacity to park all these vehicles.
Most major cities attempt to manage parking, which always seems to be an issue, with some type of paid parking system. Often, downtown areas will have steeper prices since parking availability is often very low. Rome only charges between €.50 and €1.50 per hour depending on location and time of day (Figures 10 and 11). The entire parking system produces about €22 ($28) million (USDOT FHWA, 2006). A report by the Institute for Transportation and Development Policy found that the revenue for other cities and the amount of available parking varies greatly. Some cities produce millions of euros collecting fees with less than 50,000 parking spots, while others have a lower revenue and charge more per hour because they have a larger number of spaces (Kodransky & Hermann, 2011). Table 1 below compares the parking rate in the city center for a variety of European cities (Kodransky & Hermann, 2011). As you can see, Rome sits at the bottom of this group. Even cities with more available parking are charging higher rates than Rome.
Table 1: European City Parking Prices (2013)
| City | City Center Meter Rate (euros) |
| Amsterdam | 5.00 |
| London | 4.00 |
| Stockholm | 3.87 |
| Copenhagen | 3.86 |
| Paris | 3.60 |
| Barcelona | 2.85 |
| Antwerp | 2.50 |
| Munich | 2.50 |
| Hamburg | 2.00 |
| Strasbourg | 1.60 |
| Vienna | 1.20 |
| Rome | 1.00 |
3.2b Analysis and Impact


The centuries of Roman history buried below ground restrict the construction of underground parking eliminates possible off-street solutions. So Rome must somehow manage to fit all the cars into the existing shortage of spots. You might think the parking meters installed throughout the city would reduce congestion levels, but according to Romain Petiot’s examination of parking enforcement and travel demand, driver’s change their route and travel method based more off of road pricing such as tolls because road pricing has a more perceived relative impact (2004). In Rome, the low rate may encourage drivers to pay the parking fee, however, it does nothing to discourage parking or ease the continual shortage of parking. Even if Romans are paying for parking, they could very likely be parked in an unofficial parking spot because cars outnumber spaces by over 40%. Nonetheless, a possible solution could be a steeper rate because increasing the price of parking often shortens the length of time a car is parked, which would have benefit Rome’s parking system (Petiot, 2004).
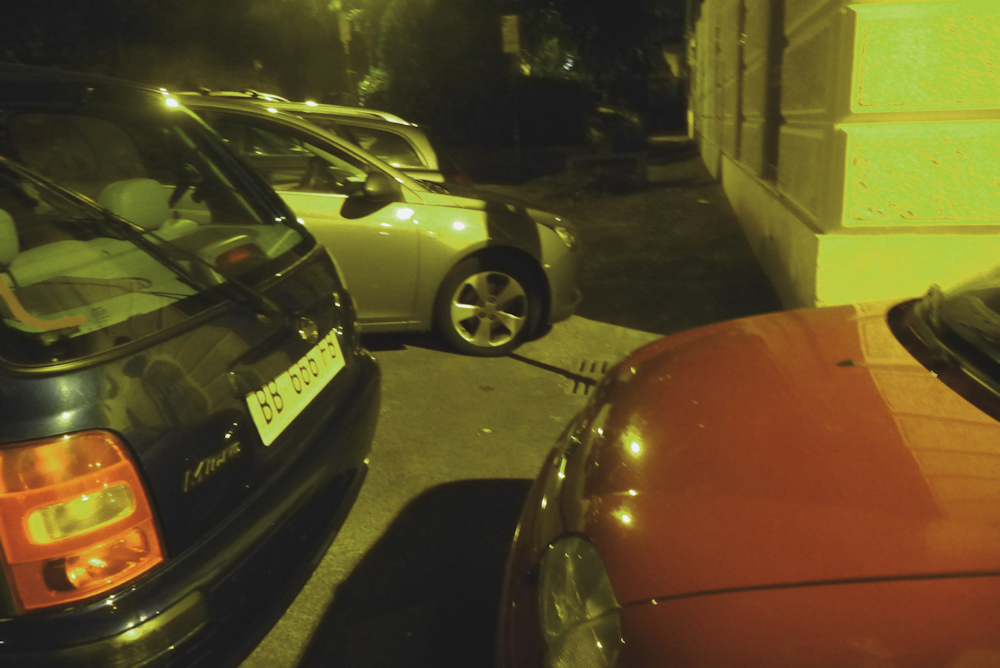
While Rome clearly has a functioning parking meter system, its effectiveness is hampered by the apparent lack of parking enforcement. In Rome, people tend to park wherever they can fit, whether legal or not. While many may still pay the parking fee (as suggested by Rome producing large revenue even with low meter rates), cars could still park improperly. Since paying for parking and legally parking is based on economic reasoning, it becomes cheaper to park illegally if there is little enforcement present. Petiot found that in most European cities, less than 10% of violators were fined (Petiot, 2004). It makes sense that violation rate is proportional to enforcement. By the number of illegally parked vehicles found in Rome, it is easy to conclude that Romans are not very worried about being issued a ticket. If Rome wants to improve the mobility of their city center, action must eventually be taken to have a widespread enforcement of parking restrictions.
In his 2004 study, Petiot claims that “parking non-compliance induces higher traffic levels and additional congestion” because ineffectively managed parking systems reduce mobility. Drivers spend additional time on the road searching for spots and sometimes cars will eventually resort to park improperly. Therefore, a poorly functioning parking system will oppose the positive steps taken by other traffic management methods and eventually hamper traffic mobility. Rome needs to improve their parking system in order to improve their overall mobility.
3.2c Horribly Parked Cars


3.3 Signal Coordination
Signal coordination is one type of ITS that involves timing signals along a corridor, or multiple corridors, in a way that moves traffic through in an efficient manner and is extremely important on major arterials. When signals are coordinated, a “green ban” appears which means you will be able to travel through the section of road and all the lights will be green, not a random mix of reds and green lights. Specifically, coordinated signals change in a cascading effect and then serve side streets. While individual intersections are controlled by a signal controller cabinet, signal coordination requires some type of central program to organize timing. Signal coordination is often just one aspect of a UTC plan and is usually used simultaneously with some type of video or loop detection for vehicle counting, as well as updates to pedestrian facilities or emergency vehicle pre-emption detection, which is more typically found in the U.S. (Cianfano, 2013).
In April of 2013, the ICT-Emission Consortium conducted a study of the mobility of Rome traffic following the installation of a new traffic signal optimization plan. The survey aimed to collect data about travel times, speeds and other driving profiles when a UTC system was both active and non-active. The study was conducted along one of the main radial arterials in the southern part of the Rome, the Via Appia Nuova. This stretch of road includes 23 traffic lights and carries an average of 2000 to 4000 vehicles per hour (Cianfano, 2013). While these are just preliminary results of a new system, an analysis of the results of this survey will give a clue to whether Rome is on the right track of traffic mobility.
3.3a Travel Time Results
Vehicle counts for the three days of study showed similar traffic volumes at count stations in the city center and on the GRA. This consistency is important when trying to isolate the effects of having UTC on or off. Additionally, to improve accuracy, almost 70 trips were taken by two vehicles equipped with GPS and fuel monitor (Cianfano, 2013). In addition to the travel times recorded by the two vehicles, ICT-Emissions also recorded travel time by using traffic cameras at three different locations along Via Appia Nuova that had plate recognition capabilities. This method of urban travel times (UTT) allowed them to enter license plates into a program that could then produce travel times based on when the plates were recorded by each camera (Cianfano, 2013). The results from each method is summarized and analyzed below in Table 2 and Figures 12 and 13 below.
Table 2: Travel Time Summary
| Direction & Time | On/Off | Travel Time (mins) | Avg Speed (km/h) | Idle Time (mins) | # of Stops |
| To city center/AM peak | Off | 27.3 | 26.5 | 8.9 | 500 |
| On | 23.8 | 29.0 | 7.1 | 390 | |
| Out of city/ PM peak | Off | 31.7 | 22.5 | 10.7 | 570 |
| On | 21.5 | 30.5 | 5.6 | 310 | |
| To city center/Off-peak | Off | 18.8 | 35.2 | 5.1 | 280 |
| On | 17.5 | 35.8 | 3.8 | 210 | |
| Out of city/AM peak | Off | 18.1 | 34.6 | 4.0 | 210 |
| On | 19.8 | 33.9 | 5.3 | 290 |
Times: AM peak = 7:30-9:30, Off-peak = 12:30-14:30, PM peak = 17:30-19:30
Graphs of UTT Travel Times


Retrieved from http://www.ict-emissions.eu/wp-content/uploads/2013/05/Cianfano-Rome-Case-Study_09052013.pdf
3.3b Analysis and Calculations
Based on the travel times gathered by the two ICT-Emission vehicles, the effect of the UTC system can be compared to when it is not running. There are several factors measured including the actual time of travel, vehicle speed, number of stops and idle time, and each of these numbers hold different significance. Travel times and average speed is important when considering the overall movement of vehicles and level of congestion. They are also the measurements most directly felt and recognized by the driver. Idle time is important to a traffic engineers when trying to reduce the amount of time vehicles spend sitting a traffic light or queue up in some type of heavy congestion as a result of a long wait. Additionally, CO2/pollutant levels and fuel consumption can be measured for idle time when analyzed with overall travel time. The number of stops also resembles idle time but can be used further to evaluate the stop-and-go condition of the road. Reducing the number of stops brings more benefits than just less travel time, it also improves safety. Traffic flow with lots of stops is more likely scenario for rear end collisions and other types of accidents.
From the results collected about idle times, we can roughly calculate the amount of pollutants that are removed from the environment when the UTC is turned on. Each class of vehicle emits a different amount of particles and the U.S Environmental Protection Agency (EPA) has calculated some average pollutant rates, which are can be found here: http://www.epa.gov/otaq/consumer/420f08025.pdf. The amount of pollutants for a light-duty gasoline vehicle sums to 1.344 grams per minute of idle time. The pollutants included in this total are the volatile organic compounds (VOC), total hydrocarbons (THC), carbon monoxides (CO), and nitrogen oxides (NOx) (EPA, 2008). Looking at the overall effect of having UTC on or off, the total difference in idle time is 6.9 minutes. This means that 9.274 grams of pollutants are removed per car when the signals had better signal coordination. Given that the road carries between 2,000 and 4,000 cars on average, this means that we can roughly computes the amount of pollutant removed a day to be around 18,500 to 37,100 grams (or about 14.8 to 29.8 pounds). To give a sense of its impact, the EPA estimates that annually a car will produce 322lbs of these pollutants. In a study of just 8 hours of travel, the 9.274 grams were removed per car. Multiplying this by three for a daily total and then by 365 day, you get that about 22lbs would be removed annually. While this is a very rough estimate and possibly erred, it suggests that even an average sized reduction in idle time could help remove a promising amount of pollutants.
In Table 1, results from the two test vehicles survey show overall improvement of traffic flow when the UTC is turned on. The direction of commuting traffic – into the city in the morning and out in the afternoon – both show the effectiveness of the new system. The number of stops was reduced by about 33% and 46% for the morning and afternoon commute, respectively. Additionally the vehicle speed increase and travel and idle time decrease in every run by anywhere from 12% to 48%. On the other hand, both heading out of the city in the morning and in between 12:30-14:30 saw different results. Average travel time and speed were varied around 10% between the on and off runs. When looking at “non-commuter routes” with lower volumes, you see different results. Interestingly, the off peak time going into the city center saw a roughly 30% decrease in stops and idle time, but going out of the city during the morning was actually worse by nearly 30% when UTC was on (Cianfano, 2013).
Graphs 1 and 2 show different results gathered by the automatic license plate readers of cars heading into the city center. Graph 1 show dramatic improvement in section A (the first half of the observed area) while the second graph’s results are affected by construction in that area, which negates the positive effect of the UTC. In the morning peak of section A, the travel time is reduced by roughly 30 to 40% (Cianfano, 2013). Similar to the results in Table 1, off peak times of 10:30 to 12:00 do not show any improvement from being on the UTC system. In section B, the travel times are all relatively close, whether UTC is on or off. The roadwork did increase the travel times, cannot be counted as part of the results because of different driving conditions.
3.3c Conclusions and Impact
These results indicate that the UTC was effective improving these two heavily routes, but not as effect for routes that had less traffic. One possibility is that since traffic engineers knew that traffic is heaviest with commuting routes, they could have given priority to those directions at the cost of the other directions of travel. Another possible reason is some type of road condition that reduces traffic mobility, like construction, a card accident or weather. There also could simply remain room for improvement in the signal coordination programming.
Another conclusion that can be drawn from these results is that higher traffic flow volumes correspond with a more dramatic positive effect of the UTC system. Upon considering this further, this relationship makes sense. A larger volume of vehicles means that any delay or gridlock caused by poor signal timing is amplified. When there is a large queue stopped at a red light, it will naturally take longer for the entire queue to clear the intersection and reach full speed. By optimizing signal timing and creating longer stretches of green bands, and thus not making large queues stop, vehicles can be flushed through a corridor. The optimization by UTC becomes necessary when the road is over capacity. When the vehicular volumes are lower, even simpler signal systems have enough capacity to service a normal traffic flow.
The survey of travel times and vehicle speeds is important in quantifying the effect of ITS improvements and eventually long term effects on mobility. As more and more studies are done, we could see trends and solutions that could help reduce fuel consumption and improve sustainability. The more efficiently we can move from one area to another, the less time we will spend burning fuel, producing pollutants and emitting CO2. As the calculations show, signal coordination can help reduce the annual amount of pollutants emitted. In the case of the Via Appia Nuova, about 15 to 30lbs of harmful particles will be kept from polluting the environment. Even given that the numbers calculated could contain some errors, the general principle that less stop-and-go traffic improves fuel economy means that signal coordination helps reduce emissions. If cities can form a signal coordination plan to significantly and consistently improve mobility, the result could eventually be a considerable reduction of emission.
4. Summary and Conclusion
As evident from some of the conclusions drawn above, Rome is far from being a golden example of traffic management. However, it is not hopeless and does have some points of efficiency. Effective traffic management requires a comprehensive approach that proactively tries to adapt to changing transportation needs. In this study of just a few aspects of Rome’s traffic management system, we can see both success and failure. To recap, here are the highlights of the conclusions drawn previously:
- Limited Traffic Zones: Pretty Good. Rome took action to preserve the historical city center from the pollutants of cars and make the area even more pedestrian friendly. The Limited Traffic Zone program has kept up-to-date, replacing manned gates with an ITS of automatic license plate readers. Additionally, the plan has produced the desired results of reducing private traffic volumes. The downtown area, without drastically changing the physical infrastructure, its now more pedestrian friendly.
- Parking in Rome: Bad. One easily gets the feeling that the city of Rome doesn’t issue many parking tickets. While there is definitely a parking meter program in place, the rate is so low that it doesn’t discourage people from driving. Although there is no official report of the average number of illegally parked car, one would conclude the number outweighs the number of legally parked cars. To really solve Rome’s parking problem additional spaces or a dramatically different approach to how to properly park is needed.
- Signal Coordination: Okay. The urban traffic control plan that the ICT-Emissions group conducted their study on was a recent installation and showed some promising results. However, Italy has a very high rate of vehicles per household and some roads often are operating at maximum capacity. Because Rome is so dense and, like any typical major city, has heavy commuting congestion, employing urban traffic control techniques like signal coordination. Again, ITS programs like signal coordination are unobtrusive and can have a real impact. As seen in some basic calculations, a small improvement in mobility and traffic flow can help reduce pollutants and handle larger capacities.
Rome is an interesting study of modern traffic management because so much of what they do is limited by the constraints of historical preservation. Utilizing unobtrusive methods for increasing the capacity and mobility is a much more realistic and cost effective method then trying to physically change the infrastructure of Rome. There are many benefits associated with ITS and other traffic management systems, like reduction in travel times and consequently reduction of emissions and pollutants. Smart management of the road system and a stricter enforcement of current tools will greatly help Rome’s mobility. Rome is only beginning to tap the possibilities.
5. References
Berechman, Joseph. (2002, Sept 20). Transportation––economic aspects of Roman highway development: the case of Via Appia (Doctoral dissertation). Retrieved from https://catalyst.uw.edu/sharespaces/download/20382/392606?inline=1
Cianfano, M. (2013, May 8). Traffic Light Coordination – Impacts on Mobility. Rome Mobility Agency. Retrieved from http://www.ict-emissions.eu/wp-content/uploads/2013/05/Cianfano-Rome-Case-Study_09052013.pdf
EPA. (2008 Oct). Idling Vehciles Emissions for Passenger Cars, Light-Duty Trucks and Heavy-Duty Trucks. Office of Transportation and Air Quality. Retrieved from http://www.epa.gov/otaq/consumer/420f08025.pdf
Hasan, S., Yaz, E. (1999). Intelligent Transportation Systems. Retrieved from http://ntl.bts.gov/lib/15000/15600/15671/PB2000100246.pdf
(2013 July). ICT-Emissions Newsletter, Vol 3. Pgs. 1-2. Retrieved from http://www.ict-emissions.eu/wp-content/uploads/2012/04/ICT-Emissions-Newsletter-3.pdf
Kodransky, M., Hermann, G. (2011). Europe’s Parking U-turn: From Accommodation to Regulation. ITDP. Retrieved from http://www.dcba.ie/wp-content/uploads/2012/04/European_Parking_U-Turn.pdf
Macaulay, D. (1974). City: A story of Roman Planning and Construction. New York, NY: Houghton Mifflin Company. Pages 42-45
Nussio, F. (2007). Access restriction in Rome/Italy. Etlis. Retrieved from http://www.eltis.org/index.php?id=13&study_id=2293
Petiot, R. (2004 Oct 13). Parking enforcement and travel demand management. Transport Policy, Vol 11. pp 399-411.
Roma Mobilita. (n.d.). The LTZ of Rome. Retrieved from http://www.agenziamobilita.roma.it/en/ztl/ztl.html
Stathopoulos, A., Valeri, E., Marcucci, E., Nuzzolo, A. & Comi, A. (2012). Urban Freight Policy Innovation for Rome’s LTZ: multiple perspectives. Edward Elgar Publisher. Retrieved from http://www.researchgate.net/publication/236951153_Acceptability_of_freight_policy_innovation_for_Romes_LTZ_A_stakeholder_perspective
USDOT FHWA. (2006, May). Managing Travel Demand: Applying European Perspectives to US Practice. Retrieved from http://international.fhwa.dot.gov/traveldemand/t1_p08.cfm

